Decrease safety stocks with 25% with a decrease in service level. That sounds like a good deal! And it is quite easy to establish by differentiating service level targets. By aiming for high service levels of inexpensive fast movers and a lower service level of expensive slow movers, a good service level can be obtained on average against minimal inventory costs. But what is the best way to differentiate these service level targets?
Albeit theoretically optimal to formulate a service level target for each individual item, dependent on the item characteristics, this approach is rather unpractical. A more convenient road to travel is to classify the assortment into categories and to set a service level target per category. This raises the question to what a good classification is.

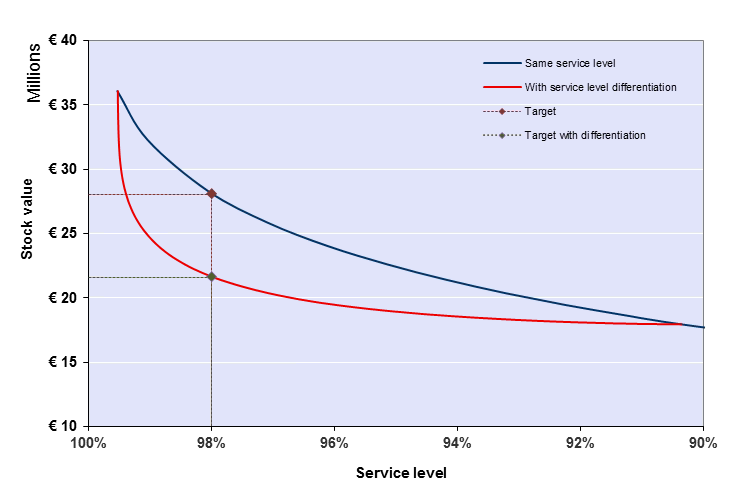
Example of the benefits of service level differentiation. By allowing service level differentiation the inventory levels could drop from € 28.0mto € 21.6m, a difference of almost 25%.
The most classic form of classification is the ABC-analysis. In its most original form the assortment is ranked to revenue (sales x sales price). According to Pareto’s Law, a.k.a. the 80/20-rule, about 80% of total revenue is earned by only 20% of the items. Since these items contribute largely to revenue, these items are then considered to be important and labeled as A-items. Pareto’s Law further predicts that the next 15% of revenue is earned by the next 30% of the assortment. These items are labeled B-items. Finally, last 5% of total revenue is earned by the remaining 50% of the assortment. These items contribute only limitedly to revenue and are deemed as less important. These C-items are on every supply chain managers list to be discarded.
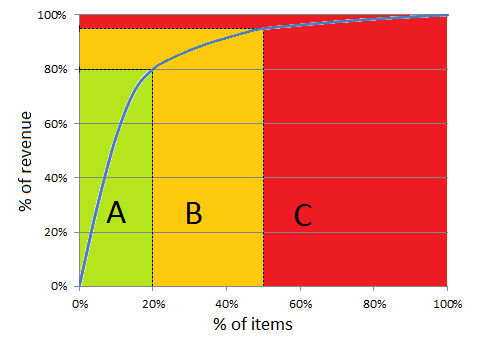
Example of a Pareto-classification. The 20% of items raising 80% of revenue are A-items, the next 30% are B-items and the remainder are C-items.
Often this classification is used for many … within a company. A-items deserve more attention at forecasting demand, a higher service level target, are purchased more often, etc. However, this ABC-analysis is not a good method to base the service level target on. Indeed, a fast moving item can easily be a C-item if the sales price is relatively low. While the customer expects and demands a high service level for this type of item. Reversely, a slow moving item can still be an A-item if it is expensive. And such an item is relatively expensive to keep on stock.
To deal with this issue, a two-sided ABC-analysis can applied, sometimes referred to as the ABC/XYZ-analysis. In this analysis not only revenue is considered, but simultaneously a second criterion, such as sales or the number of order lines. This results in a 3×3-matrix. For every square of the matrix a different service level target can be set.
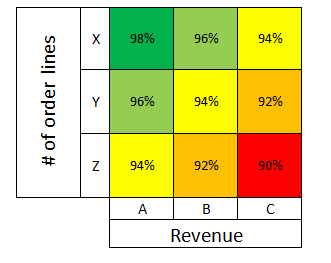
Example of an ABC/XYZ-analysis. The AX-items, the items with highest revenue and most order lines are given the highest service level target. The CZ-items, the items with lowest revenue and least number of order lines, the lowest.
By applying the right criteria in this analysis, high savings can be obtained. Two things are important in this respect:
- How important is the item for the overall service level?
- How expensive is the item to keep on stock?
The answer to the first question is for example the number of order lines. Fast movers have a higher impact on overall service level than slow movers. However, if the service level is measured in units instead of order lines, then sales is a good criterion as well.
The answer to the second question essentially depends on all factors that normally influence safety stock. That is, predictability of demand, lead time and supplier reliability. The sales price of the item is important, as well as the lot size. By considering all these factors you can determine a “safety stock factor”. The higher this safety stock factor, the more expensive it is to aim for a high service level for that item.
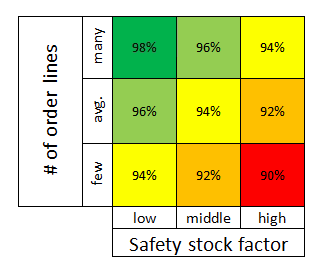
Example of the adjusted analysis. Items with the lowest safety stock factor and most order lines receive highest service level target. Items with highest safety stock factor and least order lines, the lowest.
Again a 3×3-matrix is formed, but this time based on all factors influencing service level and inventory costs. Applications of this technique show that a 25% reduction in safety stocks is possible, compared to the more classic ABC/XYZ-analysis, with loss of overall service level.